Base Management and Performance Fees for Life for Private Offering Investors
Other fees or expenses may apply.
Operating Capability
Prospect Real Estate has owned and operated 110 commercial real estate properties (83 multifamily), worth $3.9B since 2012 generating top quartile returns.⁴
Monthly Income Potential
PCRED has paid consistent monthly distributions since commencement of operations by investing in stabilized, cash-flowing assets with common equity subordination on ‘reset’ property valuations.³
Significant Market Opportunity
Unencumbered by legacy assets and liabilities, we believe PCRED is well positioned to capitalize on the $5T of expected U.S. commercial real estate mortgage loan maturities through 2030.⁵
PCRED targets preferred equity, mezzanine loans and senior loan investments secured by multifamily assets across the U.S.
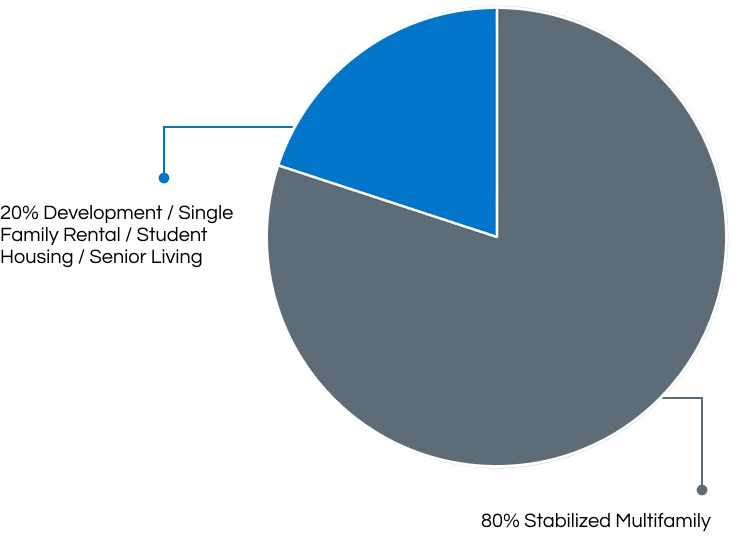
Target Investment Allocation
Target Asset Allocation
PCRED Edge
Collateral Standard
PCRED lends on stabilized, cash-flowing Class A/B multifamily assets with a focus on capital preservation and current yield.
Competitive Capitalization
PCRED can offer borrowers a competitive total blended cost of capital as an approved issuer of subordinate debt behind agency senior, which may expand the opportunity set.
Structural Leverage
PCRED’s investments have “built-in” property-level leverage and with approved enforcement rights and remedies including a change of control and forced sale provisions.
Conservative Risk Profile
PCRED finances institutional-quality assets up to a portfolio average Loan-to-Value (LTV) of 75% with common equity subordination based on ‘reset valuations’.
Prospect Real Estate
Prospect Real Estate’s dedicated in-house asset and construction management teams enhance underwriting and operational capabilities.
Prospect Capital Management, L.P., is an SEC-registered investment adviser that, along with its predecessors and affiliates, has 39 years of experience targeting high-yielding debt and equity investments using both private partnerships and publicly traded closed-end structures.
Capital Invested
$0B
Realized Investments⁶
0
Initial Property Value
$0B
PCRED is Offering No Management or Incentive Fees for Life for Private Offering Investors⁴
Company
Prospect Credit REIT, LLC (“PCRED”)
Structure
Delaware LLC converting to non-listed Maryland C-Corp with REIT tax election
Offering
Private placement of up to $100 million and only available to accredited investors
Advisor | Sponsor
Prospect Credit REIT Advisor, LLC (“Advisor”) | Prospect Capital Management, L.P. (“Prospect” or “Sponsor”)
Sponsor Investment
$10 million minimum from Sponsor and/or its affiliates. Up to $50 million “backstop” commitment funded during the Private Offering.
Base and Performance Fees
Investors in the Private Offering will pay no base or performance fees for the life of their investment
Lock-up
Two years from commencement of the Registered Offering. If the Registered Offering begins after January 1, 2027, the lock-up shortens so it never runs past December 31, 2028. Sponsor will maintain a minimum investment of $10 million until Company reaches $500 million of aggregate contributions.
Distribution Frequency
Monthly
Distribution Reinvestment Plan
Stockholders may elect into the Distribution Reinvestment Plan
Expenses
In Private Offering, (i) Organization & Offering Expenses are paid by Advisor, reimbursed after Company reaches $250 million in aggregate gross proceeds during the Registered Offering, and (ii) Operating Expenses are paid by Advisor After launch of the Registered Offering, Advisor will be reimbursed for Operating Expenses subject to an expense limitation agreement
Leverage
Zero fund-level leverage target during the Private Offering
Tax Reporting
Schedule K-1 in Private Offering; Form 1099-DIV thereafter (U.S. investors)
There is no guarantee that PCRED will be able to qualify as a REIT.
The performance data quoted herein represents past performance as of 6/30/2026. Total return is calculated based on total distributions paid to investors for the period plus the change in net asset value attributable to investment operations, divided by net asset value attributable to new investor subscriptions. Past performance is not indicative of future returns and returns are not guaranteed.
Distribution rates are calculated by dividing total payout to investors on a per share basis by the current net asset value per share. Past performance is not indicative of future returns and distributions are not guaranteed. To date, distributions paid have been 100% covered by Net Investment Income.